
Database schema diagrams
Use a database schema diagram to show the shape of your data: a relational schema drawn as
an entity-relationship diagram. It uses Mermaid’s erDiagram. In the example, a customer
places orders, each order contains order_items, and every line item points at a
product. ORDER_ITEM is the join table that resolves the many-to-many between orders and
products.
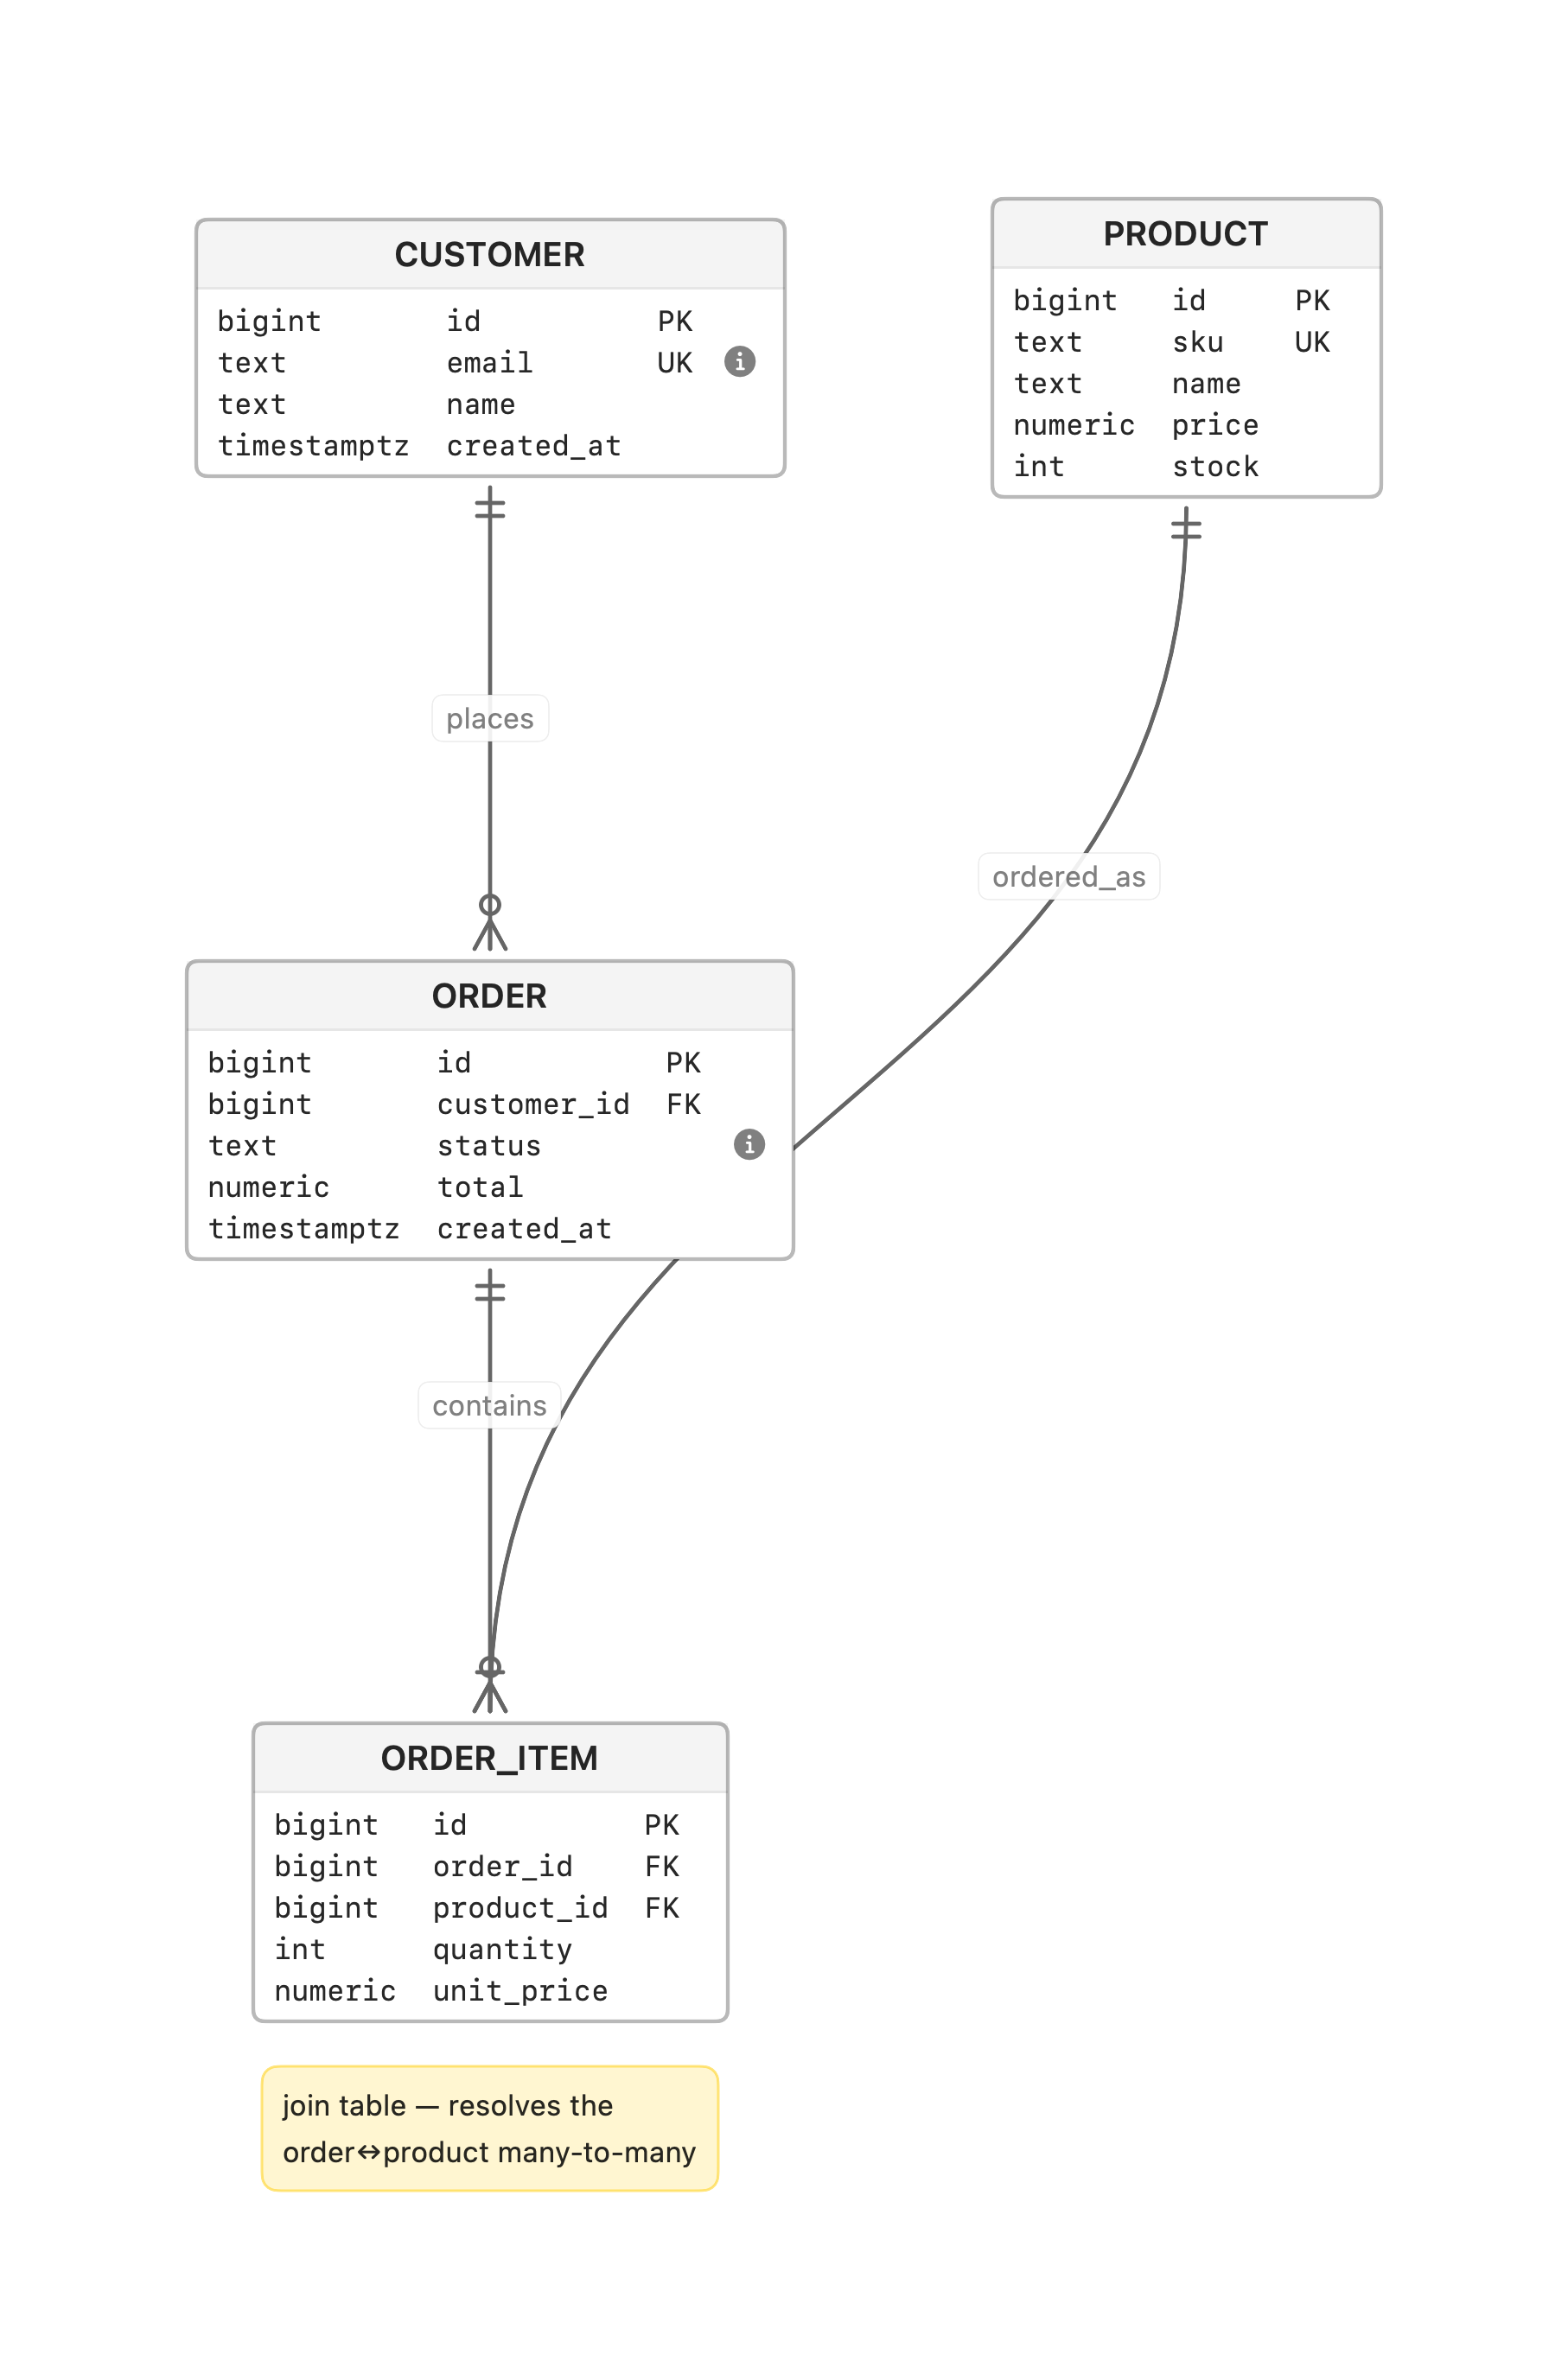
erDiagram  CUSTOMER ||--o{ ORDER : places  ORDER ||--|{ ORDER_ITEM : contains  PRODUCT ||--o{ ORDER_ITEM : ordered_as
  CUSTOMER {    bigint id PK    text email UK "lowercased on write"    text name    timestamptz created_at  }  ORDER {    bigint id PK    bigint customer_id FK    text status "pending | paid | shipped | cancelled"    numeric total    timestamptz created_at  }  PRODUCT {    bigint id PK    text sku UK    text name    numeric price    int stock  }  ORDER_ITEM {    bigint id PK    bigint order_id FK    bigint product_id FK    int quantity    numeric unit_price  }
The first keyword is erDiagram.
- Relationships read
A <card><line><card> B : label. The crow’s-foot cardinality markers sit at each end:|ozero-or-one,||exactly-one,}ozero-or-many,}|one-or-many, mirrored on the near side aso|,||,o{,|{.<line>is--for an identifying relationship or..for non-identifying. The label names the relationship. For example,CUSTOMER |o..o{ NOTE : "may leave"is an optional, non-identifying link. - Each
ENTITY { … }block lists columns astype name [key]. Column tags render as badges (PK,FK,UK), and a quoted string after a column becomes an info note.
The same web shop is modelled as an object graph and a lifecycle on the
Class & State page. To colour a table, use a
vizzy-fence style override. Mermaid’s own style/classDef
only apply inside flowcharts.