
Pie charts
Use a pie chart to show the share of a whole: a few categories sized by their proportion of a total.
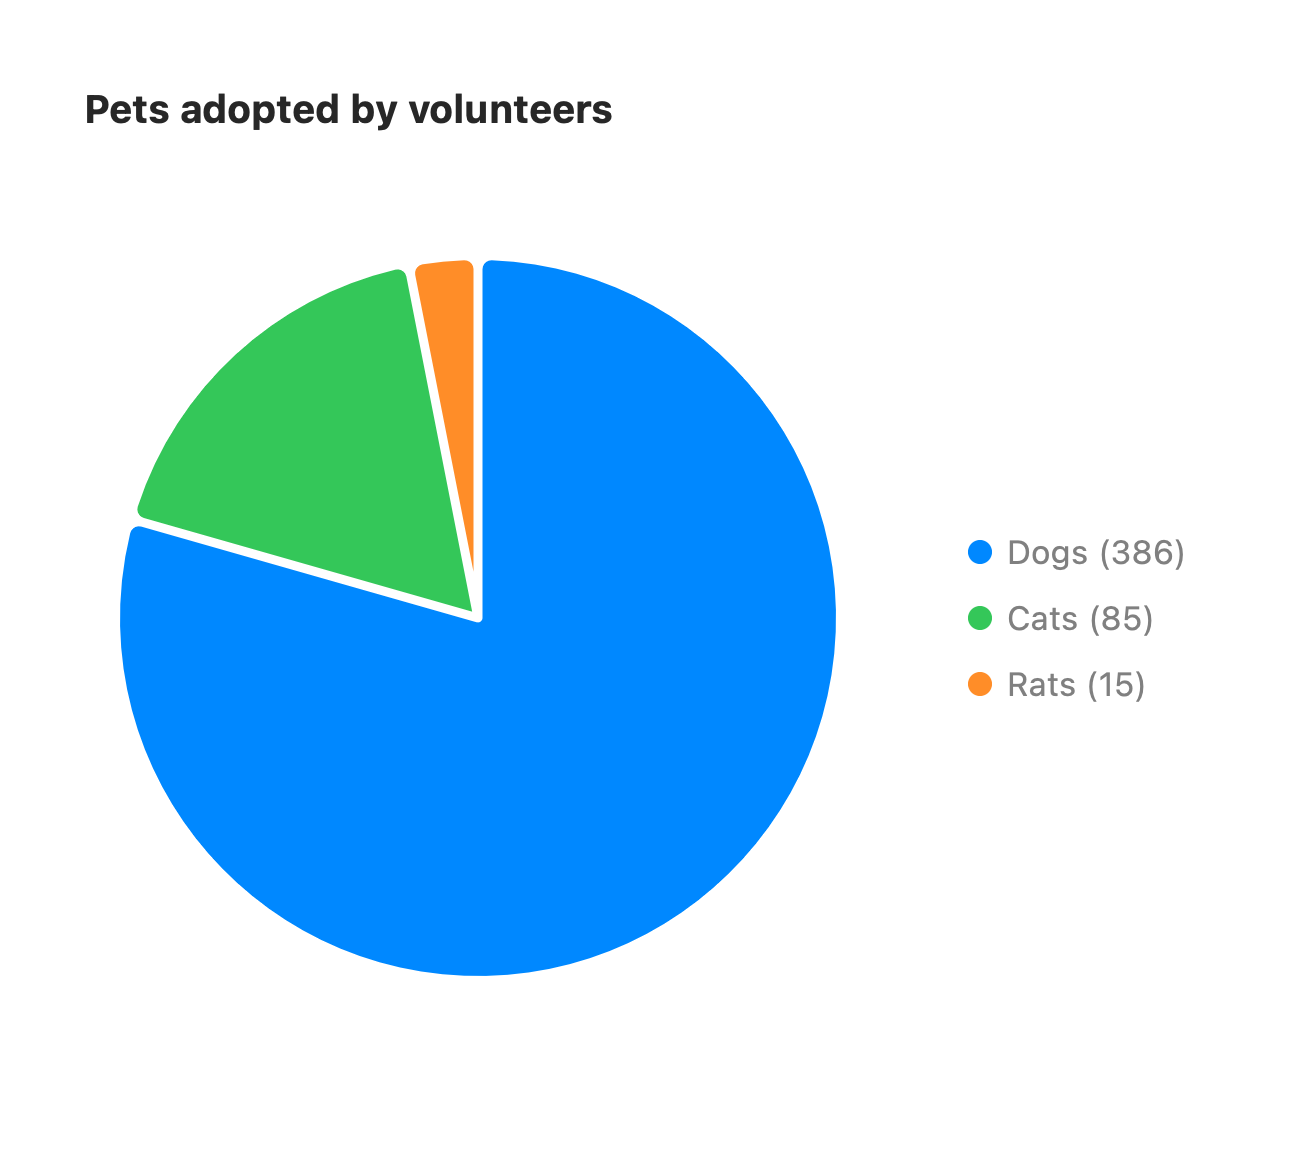
pie showData title Pets adopted by volunteers "Dogs" : 386 "Cats" : 85 "Rats" : 15The first keyword is pie. An optional showData, before or after title, appends each
slice’s raw value to its legend entry. The title may sit on the pie line (as above) or
on its own line.
Each remaining line is a slice: "Label" : value (the quotes are optional). Values are
numbers. A slice with a non-numeric or negative value is skipped, so a chart always
renders. Slice angles and colors are computed automatically.