
Git graph
Use a git graph to explain a branching workflow. Commits run along a time axis, each branch gets its own coloured lane, and merges curve back in.
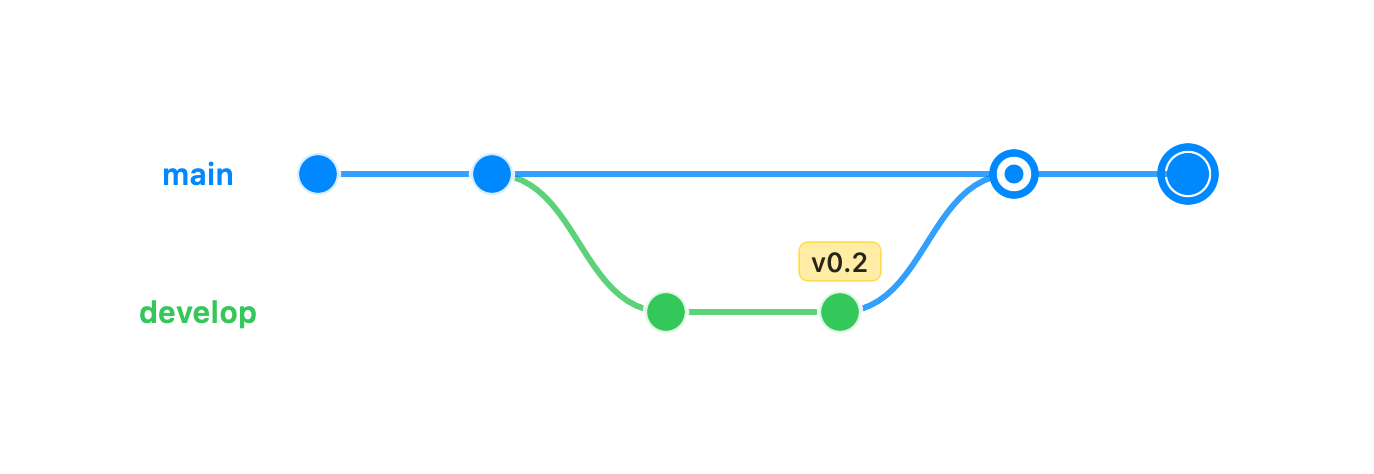
gitGraph commit id: "init" commit branch develop checkout develop commit commit tag: "v0.2" checkout main merge develop commit type: HIGHLIGHTThe first keyword is gitGraph. Each command on its own line builds the history in order:
commit: adds a commit to the current branch. Options:id: "name"(otherwise one is generated),tag: "v1.0"(drawn as a small flag above the dot), andtype: NORMAL | HIGHLIGHT | REVERSE(a bold ring, or an ✗ for a revert).branch <name>: forks a new lane from the current commit and switches to it.checkout <name>/switch <name>: makes<name>the current branch.merge <name>: merges<name>into the current branch as a two-parent commit, drawn with a curve back to the merged lane. Accepts atag:too.cherry-pick id: "…": adds a commit on the current branch that references another.
Every commit takes the next slot along the time axis, left to right by default. Each
branch takes the next lane down. Add gitGraph TB: (or TD:) on the first line to run
time downward instead, with lanes side by side. Unrecognized fields are ignored, so a
partial graph still renders.