
User journey diagrams
Use a user journey to show what an experience is like: the steps someone goes through, each scored by how it feels, so the highs and lows are visible at a glance. The scores plot as a satisfaction line above the steps.
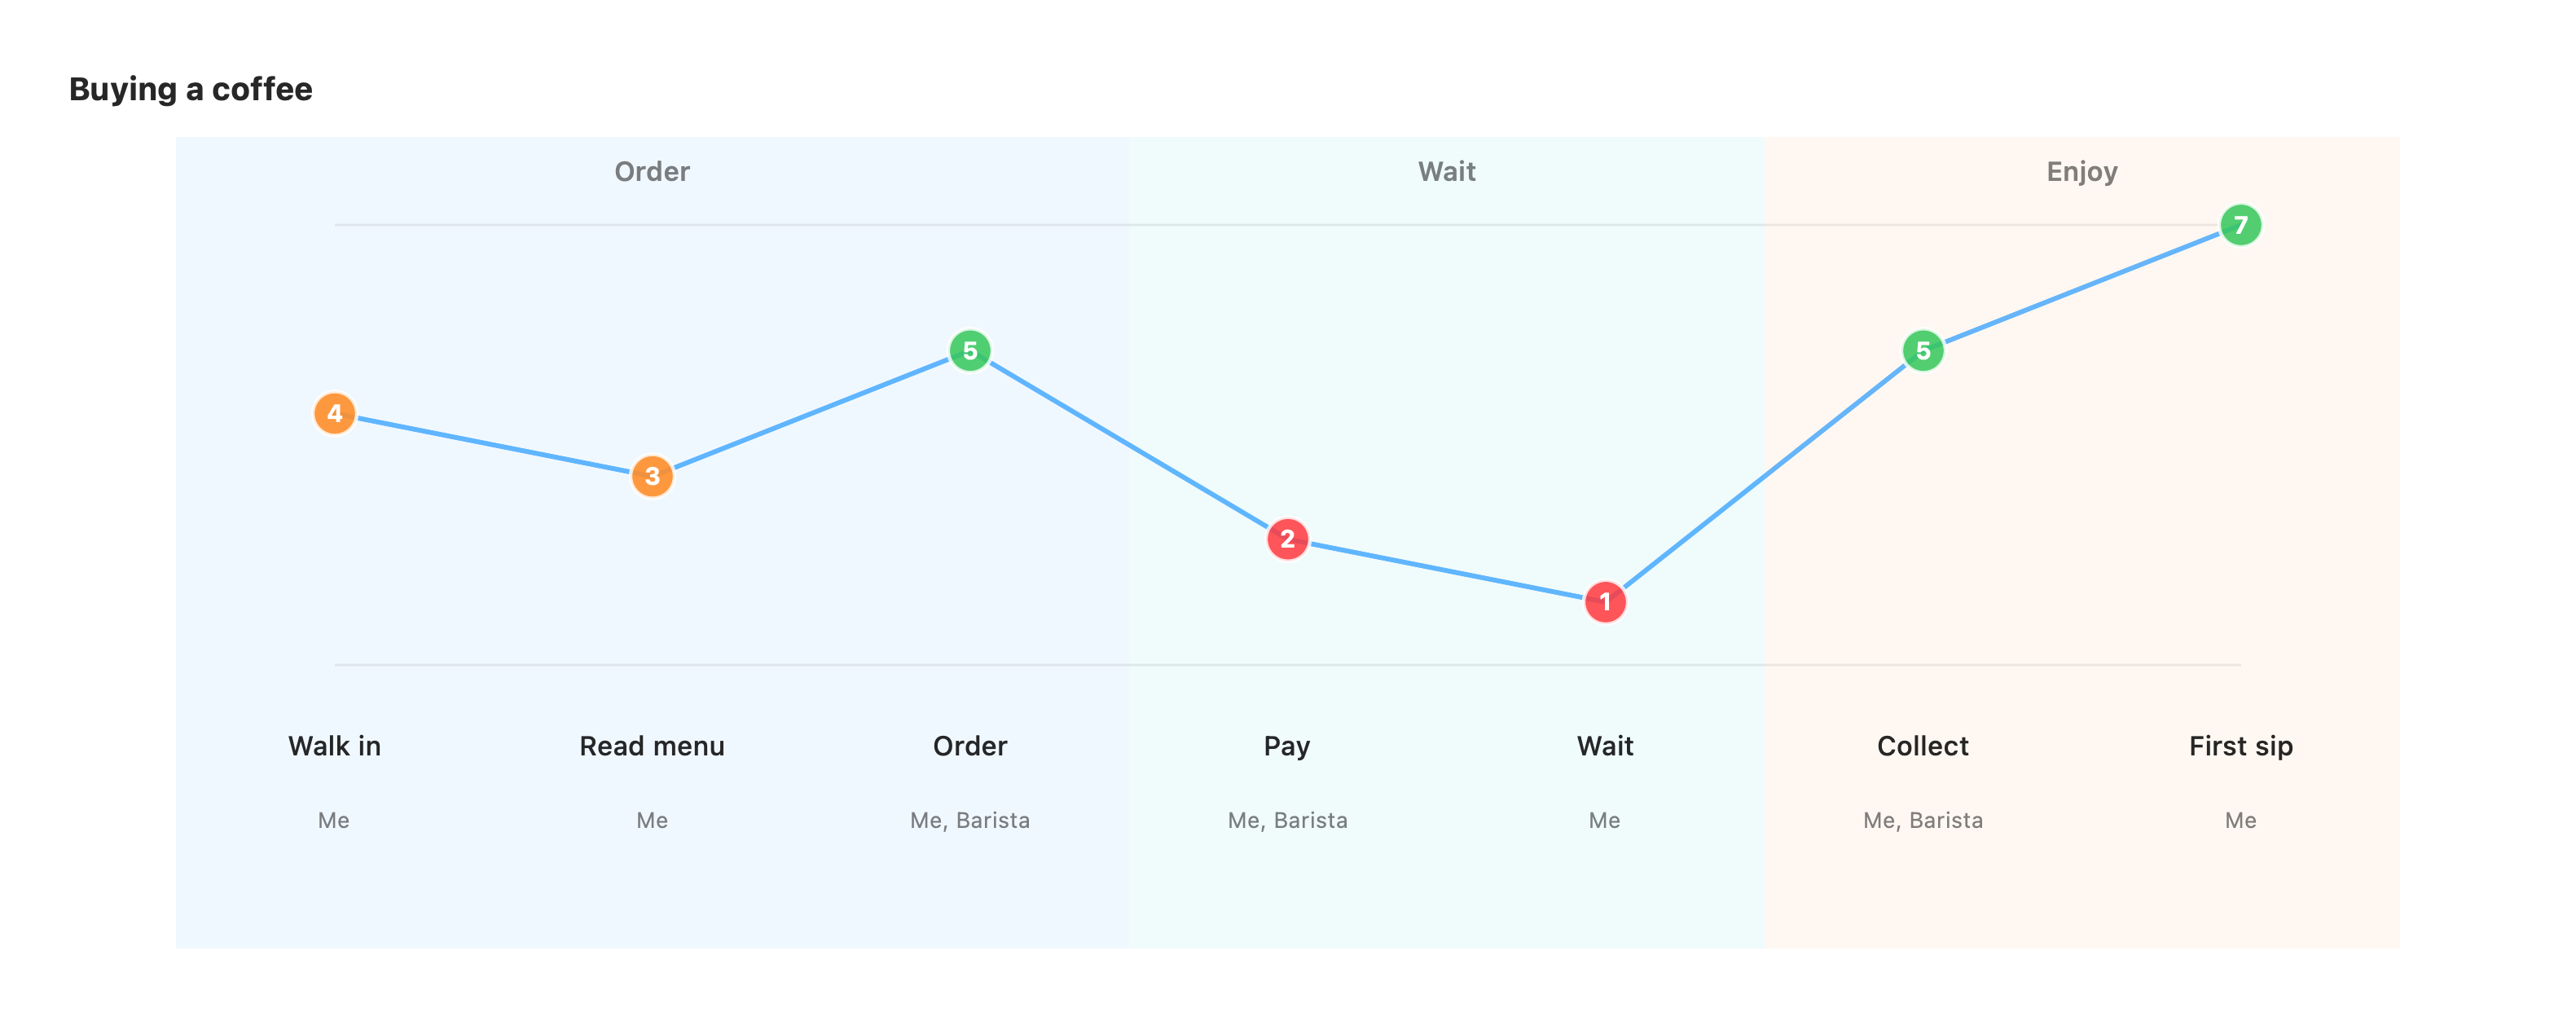
journey title Buying a coffee section Order Walk in: 4: Me Read menu: 3: Me Order: 5: Me, Barista section Wait Pay: 2: Me, Barista Wait: 1: Me section Enjoy Collect: 5: Me, Barista First sip: 7: MeThe first keyword is journey. title is optional. section <Name> groups the steps
beneath it into a phase.
Each step is a row: <task> : <score> : <actor> [ , <actor> … ].
- task: what the person is doing at this step.
- score: a satisfaction rating. Higher is better. The scores connect into a line, so dips (frustrations) and peaks (delights) stand out.
- actor: who is involved, comma-separated. Each actor gets a marker on the step.
Unrecognized lines are ignored, so a journey always renders.
Annotations
Section titled “Annotations”In a vizzy fence after the diagram, target a step by its task label:
desc Wait: the longest minute of the dayhint Pay: [Friction]("the card machine is always slow")style Wait fill:rednote over Order: the barista knows my namedesc <task>: text: a caption under the step.hint <task>: …: a click-to-open info badge at the step’s top-right.style <task> fill:…: colour a single step with a palette colour to flag a pain point or a highlight.note over <task>: text: pin a sticky note to the step’s column.
See the directives reference for the full list.