
Quadrant chart
Use a quadrant chart for a prioritisation grid. Score items on two axes and the four quadrants show where each one lands: impact vs effort, reach vs cost, and so on.
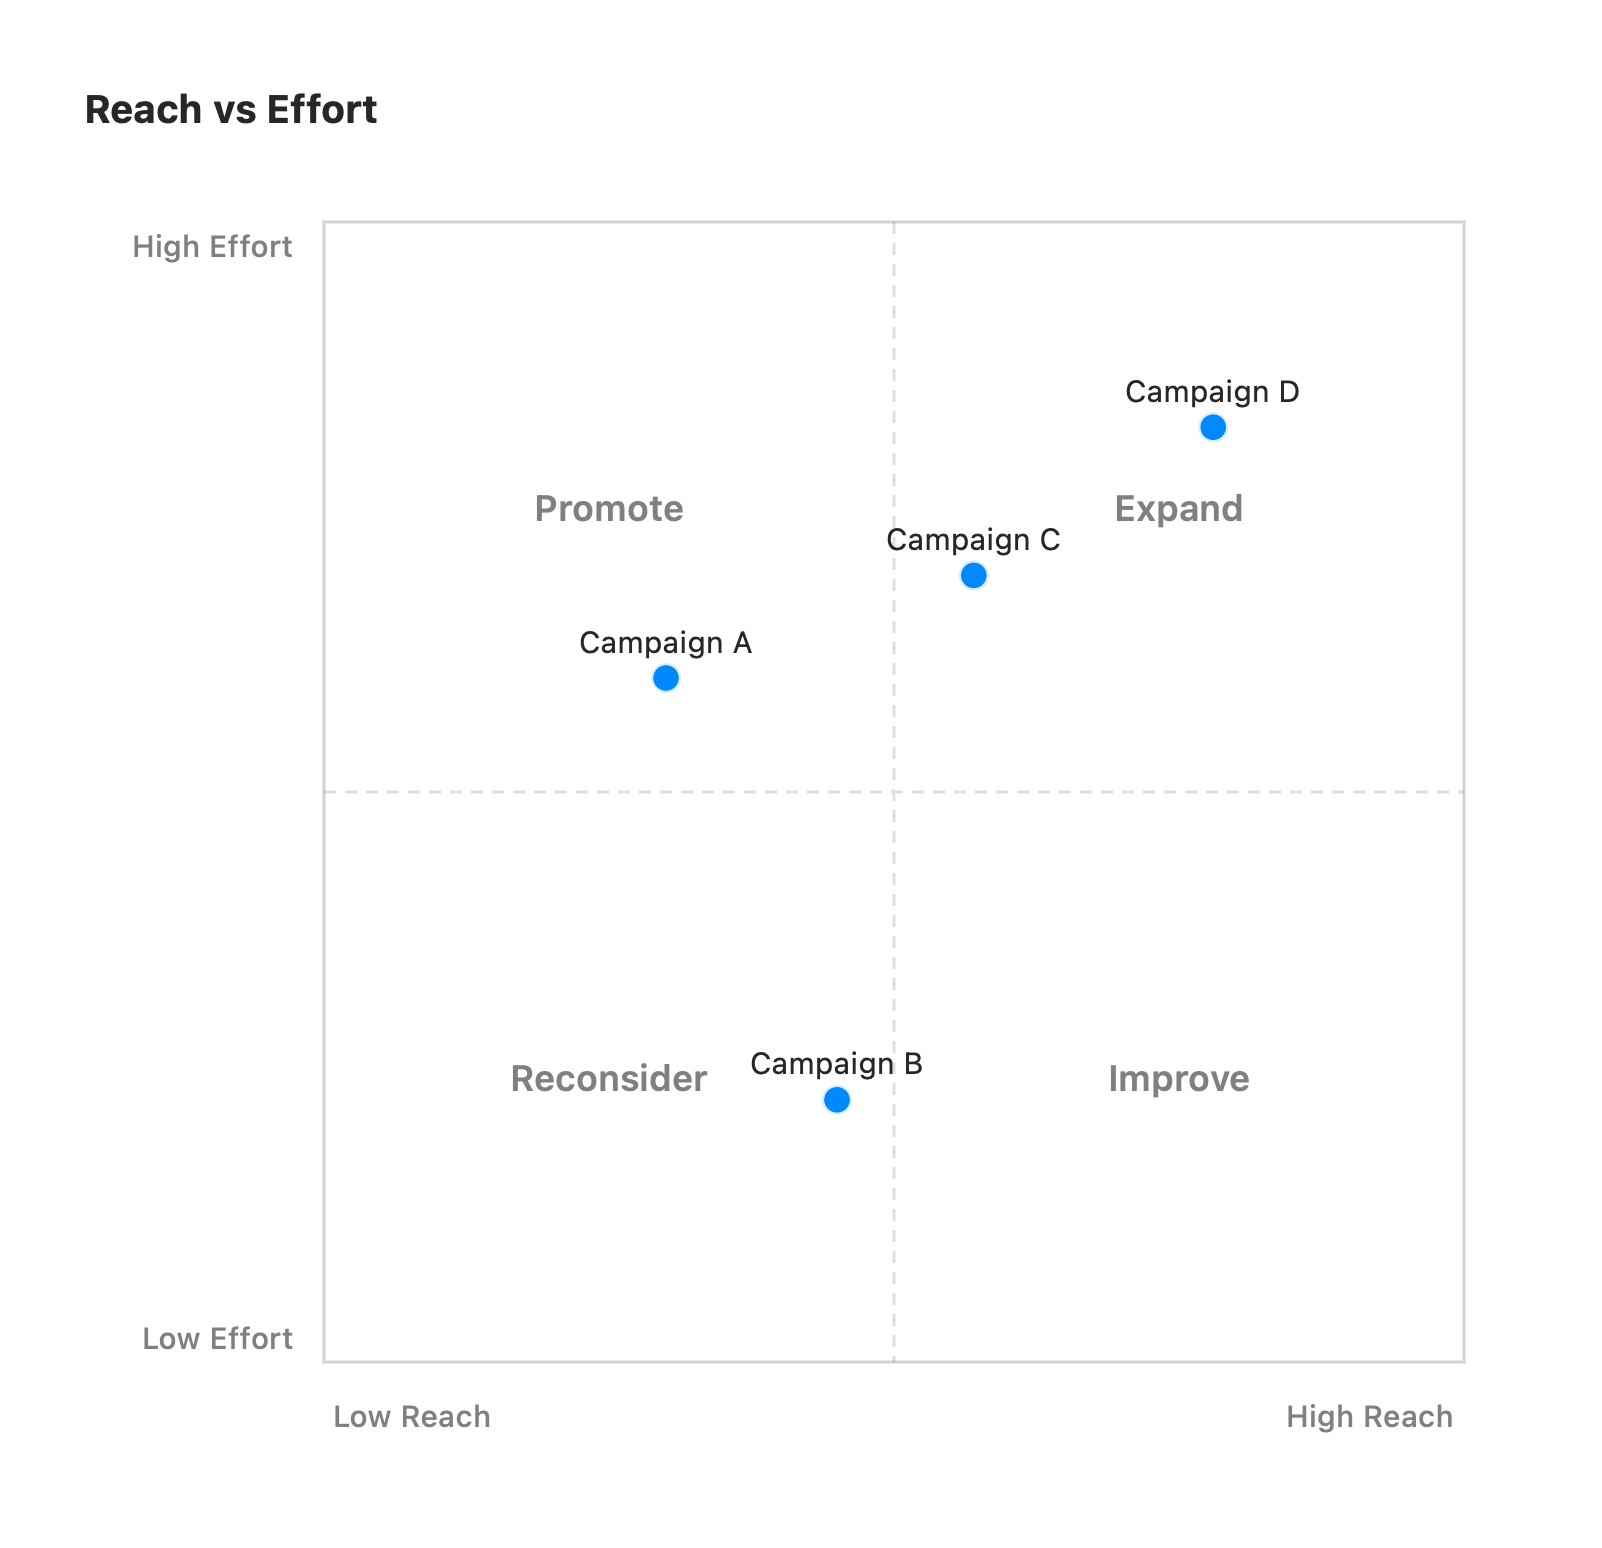
quadrantChart title Reach vs Effort x-axis Low Reach --> High Reach y-axis Low Effort --> High Effort quadrant-1 Expand quadrant-2 Promote quadrant-3 Reconsider quadrant-4 Improve Campaign A: [0.3, 0.6] Campaign B: [0.45, 0.23] Campaign C: [0.57, 0.69] Campaign D: [0.78, 0.82]The first keyword is quadrantChart. The aliases 2x2 and 2-up parse
identically. An optional title sits on its own line.
x-axis <left> --> <right>: labels the horizontal axis ends. The--> <right>half is optional.y-axis <bottom> --> <top>: labels the vertical axis ends.quadrant-1…quadrant-4: title each quadrant. Mermaid numbers them anticlockwise from the top-right: 1 top-right, 2 top-left, 3 bottom-left, 4 bottom-right.Label: [x, y]: plots a point. Both coordinates run0to1from the bottom-left corner, so[1, 1]is top-right. Values outside that range are clamped.
The plot is a fixed square split into four tinted quadrants. Unrecognized lines are ignored, so a partial chart still renders.
Hover hints on points
Section titled “Hover hints on points”Attach a hint to any point by its label, in a vizzy fence below
the chart. The plotted marker is the target. Hover it for the note, or click to open a
link. No extra (i) badge is drawn.
quadrantChart title Reach vs Effort x-axis Low Reach --> High Reach y-axis Low Effort --> High Effort Campaign A: [0.3, 0.6] Campaign C: [0.57, 0.69]hint Campaign A: [Details]("**Campaign A**: 2.3M reached, 18% conversion.")hint Campaign C: [Brief](campaigns/c.md)A quoted destination is inline markdown shown in a hover card. An unquoted one is a
relative path to a file that opens on click (a .md / .vizzy.md opens inside vizzy,
anything else in its default app). This works exactly like hints on nodes and edges.
Per-point colours
Section titled “Per-point colours”Colour an individual marker with a style <label> fill:… directive in the same vizzy
fence. The value is a palette token or a #hex:
quadrantChart x-axis Low Reach --> High Reach y-axis Low Effort --> High Effort Campaign A: [0.3, 0.6] Campaign B: [0.45, 0.23] Campaign C: [0.57, 0.69]style Campaign A fill:greenstyle Campaign B fill:redstyle Campaign C fill:#a855f7Points without a style keep the default accent colour. Labels with spaces are matched
longest-first, so style Campaign A fill:green works as written.
The same directive also colours a whole quadrant’s background. Match it by its title text
(style Expand fill:…) or, for an untitled quadrant, by position with
style quadrant-N fill:… (N = 1–4, Mermaid’s anticlockwise-from-top-right numbering):
style quadrant-1 fill:mint