
Gantt charts
Use a Gantt chart for a project schedule: tasks, durations, and dependencies laid out on a time axis.
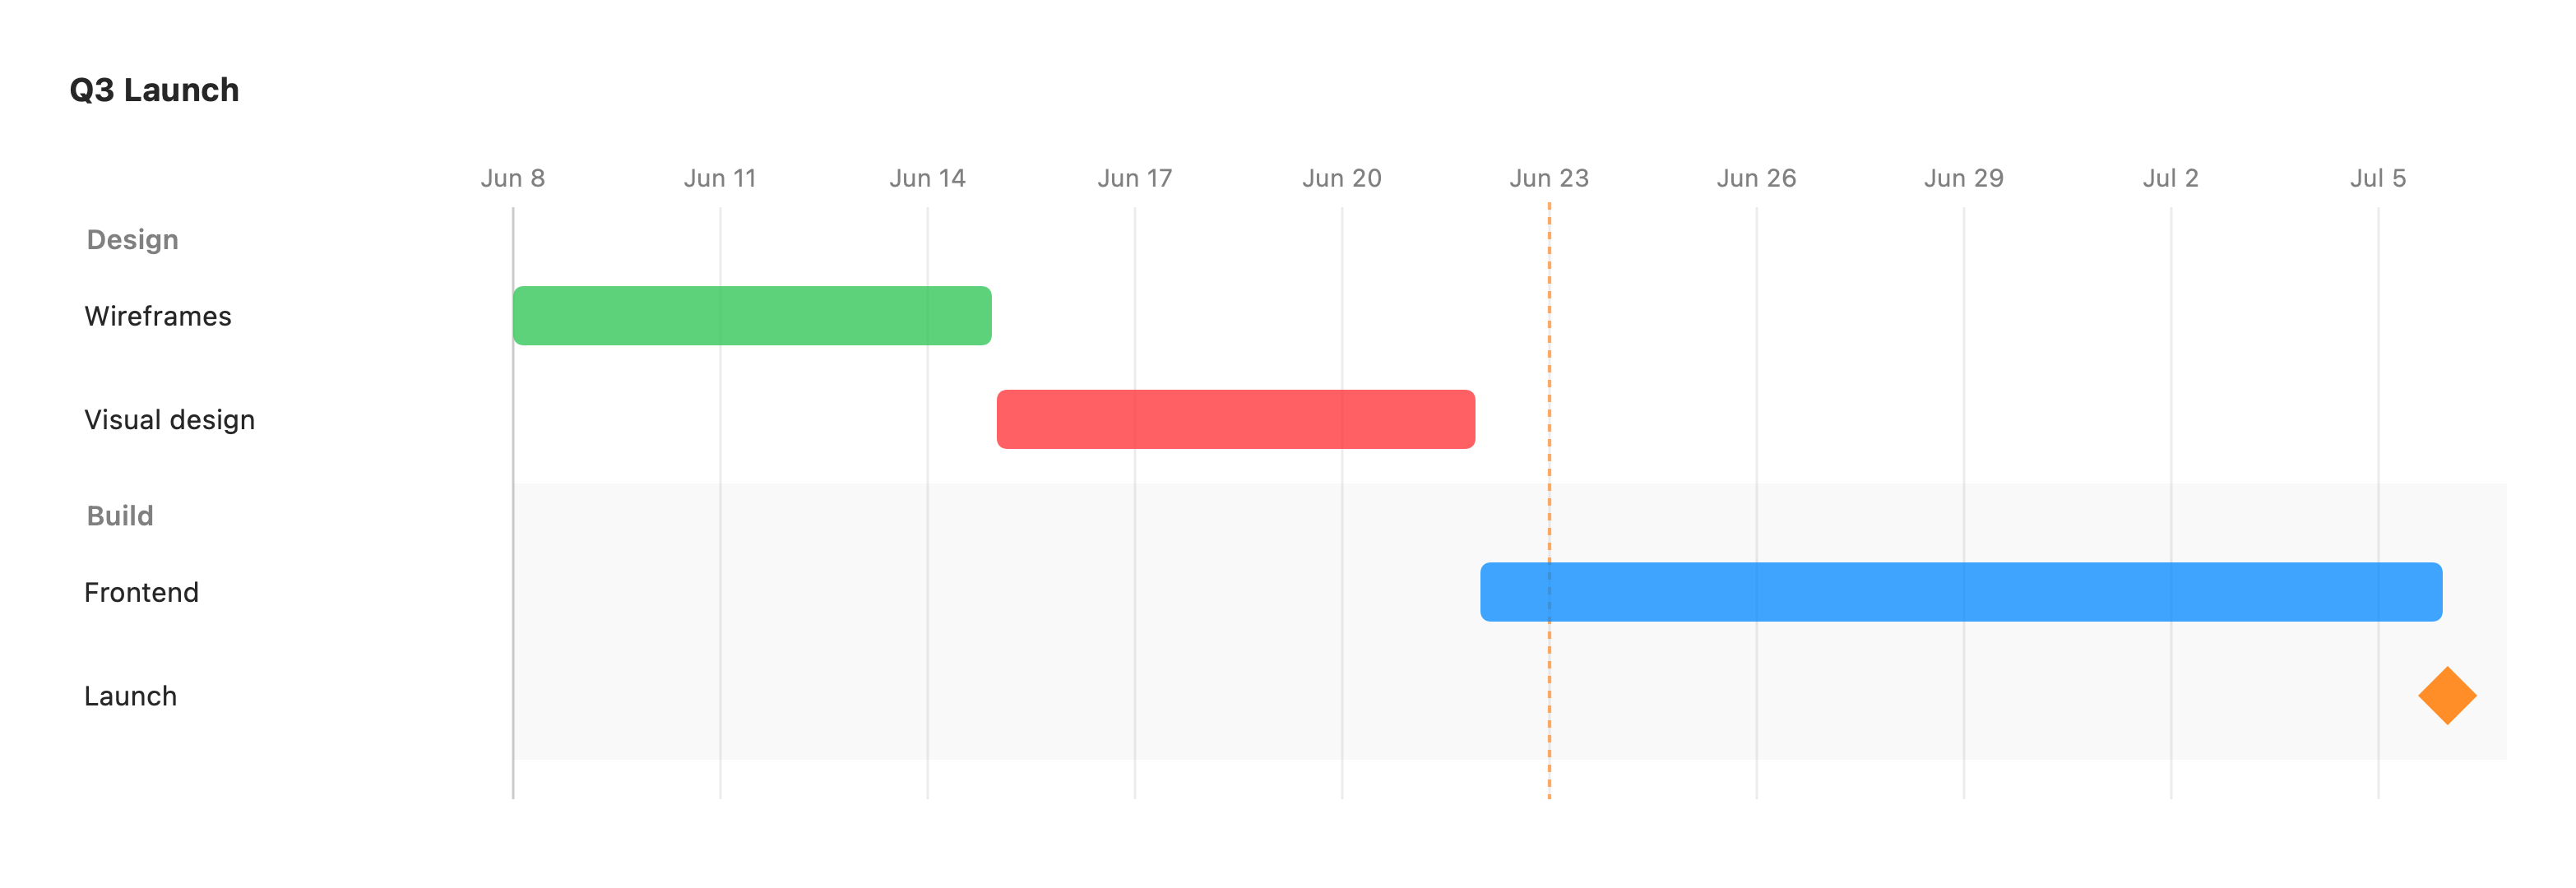
gantt title Q3 Launch dateFormat YYYY-MM-DD section Design Wireframes :active, wires, 2026-06-08, 1w Visual design :crit, visual, after wires, 1w section Build Frontend :fe, after visual, 2w Launch :milestone, launch, after fe, 0dThe first keyword is gantt. dateFormat sets how dates are parsed (default
YYYY-MM-DD). section <Name> groups the rows beneath it into a band.
Each task is a row: Label : [status,] [id,] <start>, <end|duration>.
- status (optional):
done,active,crit(critical), ormilestone. - id (optional): a handle other tasks can depend on. Generated automatically if omitted.
- start: a date (in
dateFormat) orafter <id>to follow another task. - end: a date, or a duration:
Nd(days) orNw(weeks).0dmakes a milestone point.
A vertical marker shows today when it falls inside the timeline. Unrecognized fields are ignored, so a chart always renders.
Excluded days and axis control
Section titled “Excluded days and axis control”gantt title Sprint (Mon–Fri only) dateFormat YYYY-MM-DD excludes weekends tickInterval 1week weekday monday section Work Design :done, d1, 2026-06-15, 3d Build :b1, after d1, 5dexcludes weekends: shades Saturday and Sunday columns grey. You can also exclude named weekdays (excludes monday,tuesday) or specific dates (excludes 2026-06-15). Excluded days are a visual overlay only. Task durations still count calendar days.tickInterval 1week/1day/1month: overrides the automatic axis tick spacing.weekday monday: anchors weekly tick marks to a chosen weekday.axisFormat %Y-%m-%d: sets the tick-label date format (d3/strftime%-codes).todayMarker off: hides the today marker.